|
|
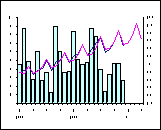
ForecastingTools Graph for Microsoft Excel
 This Microsoft Excel Add-In provides the most Known and commonly used Forecasting Tools, as Moving Average,
Simple Exponential Smoothing and Winters models for Marketing, Economics, Accounting, Operations Management.
It performs simultaneous Time Series analyses, Seasonal Indexes Calculation and Time Series Decomposition.
A simple and powerful management tool on any desktop, indispensable for those who need to perform forecastings.
| Software Information |
System Requirements |
| Version: | New |
- Windows 8/7/XP/Vista
- Pentium or similar processor
- Microsoft Excel 2000 and later
- 512 MB RAM
|
| File Size: | 1.66 MB |
| License: | Free to try, $75.00 to buy |
| Rating: |  |
ForecastingTools Graph Features:
- Moving Average: Similar to Microsoft Excel Analysis ToolPack,
this tool adds the Optimizer Function that returns the number of periods (between 2 and 6)
that minimizes the Mean Square Error.
- Exponential Smoothing: Similar to Microsoft Excel Analysis ToolPack,
this tool adds the Optimizer Function that returns the Damping Factor (between 0 and 1)
that minimizes the Mean Square Error.
- Double Exponential Smoothing: This tool allows you to apply this advanced Forecasting model.
You can define the two smoothing factors (Alpha and Beta) or use the Optimizer Function that returns the
combination of smoothing factors (between 0 and 1) that minimizes the Mean Square Error. Only available
if Correlation > 50%.
- Exponential Grownth: This tools allows you to calculate the curve that best fits the Time Series.
Extremely useful for Internet Statistics Forecasting. Only available if Correlation > 90%.
- Linear Grownth: This tools allows you to calculate the line that best fits the Time Series.
Only available if Correlation > 75%.
- What's The Best model?: This tool performs simultaneous Time Series analyses and presents the
Mean Square Errors sorted and the available methods.
- Calculate Seasonal Indexes: In many situations (e.g. ice cream sales) the Time Series values
vary from period to period according a similar pattern. This tools allows you to calculate the Seasonal
Indexes to complete your Forecast.
- Winters model for seasonal Time Series: a powerful procedure is provided to analyze highly seasonal Time Series.
- Time Series Decomposition: powerful procedures to decompose Time Series in basic
components (Trend, Cyclical, Seasonal and Random).
- Forecasting Periods: ForecastingTools Graph can forecast any number of future periods.
- High-Low-Chart: HLC module was designed to analyze stock market data and generates
a simulation of future values, incorporating past errors.
|


 BestShareware.net. All rights reserved.
 This Microsoft Excel Add-In provides the most Known and commonly used Forecasting Tools, as Moving Average,
Simple Exponential Smoothing and Winters models for Marketing, Economics, Accounting, Operations Management.


