| Make BestShareware.net your home page | Add BestShareware.net to your favorites |
 Homepage |
 Help Desk |
 Site Map |
 |
 Popular |
 What's New |
 Featured |
| MAC Software | Linux Software | Pocket PC | iPod Software |
|
XYit Image Digitizer: Captures XY data from Maps & Graphs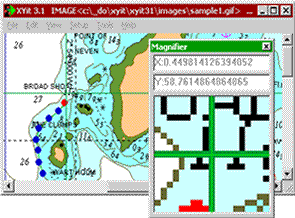 XYit captures XY coordinates from graphs and maps, enabling you to digitize points & lines back into their original x-y co-ordinates. Scientific, engineering or financial graphs, e.g. of share/equity prices,
or the co-ordinates of objects on maps and plans are all easily converted with Xyit. And you can also do the reverse - plotting xy numerical data back onto an image - ideal for showing proposed routes etc.
This unique program is an invaluable tool in image analysis, graphing, charting and mapping.
XYit captures XY coordinates from graphs and maps, enabling you to digitize points & lines back into their original x-y co-ordinates. Scientific, engineering or financial graphs, e.g. of share/equity prices,
or the co-ordinates of objects on maps and plans are all easily converted with Xyit. And you can also do the reverse - plotting xy numerical data back onto an image - ideal for showing proposed routes etc.
This unique program is an invaluable tool in image analysis, graphing, charting and mapping.
XYit is fully active for evaluation puposes for 14 days without a security code. With XYit you can digitize the xy co-ordinates of points & lines within images, enabling you to capture their original x-y values. And you can do the reverse, plotting xy numerical data back onto an image, ideal for making maps of proposed routes for reports, or for automated graph plotting to a pre-existing image. Facilities XYit offers full manual digitizing facilities with an on-screen magnifier, and also provides automatic digitizing which can follow and convert lines within an image. If your line is not continuous, you can scan your image looking for pixels of certain colors. Both automated line following & scanning operate with either the RGB or CMYK model, in which a tolerance color range figure may be set. XYit incorporates comprehensive image calibration, so that even if you image has been rotated, squashed or is not square, you can still accurately obtain the original xy values. XYit can handle dates, linear & logarithmic axes and it can be used to readout values from images of graphs and charts. The analysis tool provides the perimeter & area of a digitized line, while the statistical tool measures aspects such as standard deviation and mean. In Mapping On land XYit can be used to digitize grid based maps such as UK Ordnance Survey or road maps or plans, while in the marine field Xyit can handle nautical charts in Mercator projection, directly returning latitude and longitude values. And digitized lines can be joined from maps of different scales. Surplus points in a line can be removed using our unique thinning (generalization) algorithm. Its unique length / area tool can be used to measure field perimeter and area for building plots etc. In Science, Engineering & Finance XYit can be used for digitizing graphs, charts and plots with linear, logarithmic or date axes, such as spectral plots, gene plots, frequency response curves and financial analyses. XYit is a unique tool, with broad application in graphing, charting and mapping.
Frequently asked Questions :
Yes, load the image file into XYit or use the screen-grab function if you are using a browser. Set it up using the two corners calibration and enter the axis. Now trace the plot with your mouse. And you can export the data to a spreadsheet. The highs and lows and the dates are also displayed under Analysis|Statistics. I have a graph, on paper, of GDP year on year for the major economies of the world. Can XYit help me to put the data into a spreadsheet? Yes, scan the graph, and import it into XYit as a bmp, jpeg, tiff or gif. Click on the graph axes and enter their true values. Since the graph may not have been quite straigh in the plotter, set it up using 3 or 4 corners using the image calibration facility. Trace the graph with the mouse, or use the auto-trace facility. You can save this data to the clipboard and simply load it into a spreadsheet. My graphs do not start at zero, can XYit handle this? Yes, even though the graph does not start at zero it does not matter at all. The cursor will still read out in graph co-ordinates. What if my image (map or graph) is not scanned in exact alignment? It does not matter at all. Setup (calibrate) the image on 3 or 4 corners and XYit takes out the effect of this rotation. When should I calibrate on 2,3 or 4 corners? If the image is in perfect alignment, like a graph from a financial website, you only need to click 2 corners and enter the axis values. If the image was originally rectangular and may have been squashed or rotated during scanning then you should use 3 corners. If the image has been distorted so that the graph axes do not now form a rectangle, for example by photography or by paper stretching - then you should calibrate on all 4 corners. It does not matter if you calibrate on more corners than is absolutely necessary. My scanned image was of a 100 year old nautical chart but it has no axes or gridlines which are visible. But I do know the latitude and longitude of 3 objects, 2 lighthouses and a church which have not moved in the last 100 years! Can XYit recover positions of other objects in my chart image? Yes, by using three points, XYit will scale the image correctly and will compensate for any inadvertent rotations of the image. I have an old map with 3 churches on it. These 3 churches still exist, but I don't know what happened to the old mill which was shown on the map. Can XYit help me to locate exactly where the mill was? Yes, take a GPS to each church and note down the position co-ordinates. Scan the map into your computer and load it into XYit. Use the Setup|By Triangle 3 point calibration, and click and enter the 3 values for the churches. Now the XYit cursor will read out any point on the map in GPS co-ordinates. Place the cursor over the mill on the map and you will see the GPS co-ordinates displayed. Enter these co-ordinates into your GPS and go and find where the mill was. This will work for both latitude & longitude, and northings & eastings. I am a diver and I have some old nautical fathoms chart. I want to put the co-ordinates of the wrecks shown on these charts into a spreadsheet. The problem is the charts may have got wet and may not be exactly rectangular. Can XYit help me? Yes, scan the charts into your computer and use the Setup|Image Calibration|By Frame using all 4 corners. If you use all 4 corners, XYit will eliminates any errors caused by a map being stretched before it was scanned. I have a graph showing the time period of a pendulum against its length, but the axes are both logarithmic. Can I use XYit to read out the data? Yes, you have two options, you can either enter the graph as logarithmic or use the normal linear scales. If you choose the logarithmic options for the axis type and enter the values at the axes as 1,10,100 etc then XYit will readout the actual values into the clipboard. If you choose linear axes you must enter the axis values as 0,1,2 which is the power of ten rather than its actual values. Now XYit will readout and export the logarithm of the values on the graph. My image is a picture of a map taken with a digital camera. It may have become squashed or distorted. How can I read the values of this image. You should use the four corner calibration and check some sample points on the graph. XYit can handle errors which are linear (affine) and product (XY) terms, the level of accuracy depends on the quality of your lens. I have a bitmap image of a map which is around 45MByte. Can XYit handle file sizes this large? Yes, XYit has been tested extensively on large graphics files without problems, thanks to licenced graphics routines from Pegasus Software.
File, Clipboard, Screen Image Formats: BMP, CALS, DCX, DIB, HRZ, ICO, JPG, MODCA, PBM, PCX, PGM, PIC, PNG, PPM, RLE, TGA, TIF, WMF, WPG Functions Rotate, Zoom-In, Zoom-Out (on cursor), scroll, drag Data Import Export User specified file, clipboard Format: ASCII X, Y Co-ordinate pairs -tab / CRLF delimited Calibration & Mapping 2 Corner Rectangular 3 Corner Linear 4 Corner Non-Linear 3 Arbitrary Known Points Linear Axes Types X Axis Linear, Logarithmic, Date, Mercator Longitude Y Axis Linear, Logarithmic, Mercator Latitude Point Digitising Manual Mouse clicks generate points in ORIGINAL co-ordinates Automatic Image Scanning / Line Following based on pixel colour Point Removal Automatic Thinning with User specified tolerance Viewer Magnified, Points Readout in Real Co-ordinates Analysis Data points Analysis, Length, Area, Standard Deviation Help Windows Help File 30 pages Technical Download Size 3.0 Mb System Requirements 6Mb HDD 16Mb RAM Operating Systems Windows 95, 98, NT, ME, XP, 2000, 2003 |
||||||||||||||||||


|
Submit Software |
Privacy Policy |
Terms of Use |
Advertise with Us |
Contact Us
Copyright ©  BestShareware.net. All rights reserved.
|