|
MultiCharts Quarterly License
 MultiCharts is a professional charting package that allows you to use thousands of
existing TradeStation studies or create your own in EasyLanguage®-compatible
language. You won't have to study anything new or redo your existing studies
-- just import ELA/ELS/ELD and apply the study to a chart. MultiCharts
supports free quotes as well as streaming data from the leading data providers/brokers
such as Interactive Brokers (TWS), eSignal, Patsystems (J-Trader), IQFeed,
MarketCast, CyberTrader, Tenfore and many others.
MultiCharts is a technical analysis and automated strategy trading platform for futures, forex,
and stock trading, featuring professional charting, advanced analytics, trading strategy optimization, and backtesting.
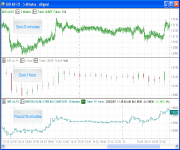
Multiple data series, of different timeframes and symbols, and from different data feeds, can be plotted in the same chart
window. Time-based and Count-based, as well as Bid, Ask, or Trade-based data series can be mixed within the same chart.
| Software Information |
System Requirements |
| Version: |
5.5 |
- Windows 2000, Windows XP
- 2 GHz Pentium 4 or compatible
- 512 MB RAM
- 1 GB available disk space
- Microsoft Internet Explorer 6.0
|
| License: | Free to try, $297.00 to buy |
| File Size: |
48.4 MB |
| Screenshot : |
View Screenshot |
| Rating : |  |
Key Features for MultiCharts Quarterly License:
- Interactivity
The charts, indicators, scales, the background and status bar - all
those objects have relevant options accessible for mouse and keyboard
control. Just click once on the desired object to fine-tune the workspace.
All movable objects can be Drag & Dropped. This ideology makes
work highly productive and convenient.
- Using several of charts in the same
chart window
Other programs allow analyzing one chart per screen. Now you can use
several in a single chart window. This is invaluable for correlation
or inter-market analysis.
- Displaying data in any format
The most often used types of charts, including bars, japanese candlesticks,
lines, points, histograms, invisible bars, etc. are for your choosing.
- Combination of different time frames
data
Use any degree of precision in your studies - combine minute, hour
and day data in one workspace. All the data will be strictly ordered
to one time axis, providing additional analysis features.
- Extended features of axis
The scales have broad display options. They may be presented as linear
or semi-logarithmic, especially useful for drastic price movements.
The scales may be displayed on both sides, i.e. with indicator on
one side of the axis and price data on the other. The scales allow
data to be displayed data for the entire period, only for the displayed
values, or in set ranges.
- A multitude of analysis techniques
with flexible settings
Over 50 in-built indicators, analysis and drawing tools. The techniques
can be presented as lines, histograms, points, columns, crosses and
other primitives. All display parameters of the indicators may be
modified to the user's needs.
- Workspace settings functions
Almost all visual parameters can be tuned. The user has control of
the fonts, line type and thickness, colors, scales, all the elements
of the status line, the background, grid, chart components. The time
and numeric scales reflect the regional settings of the computer,
so they are also set by user preference.
- Data displaying in any degree of detail
Displaying data in any degree of detail: ticks, second bars, minutes,
hours, days, weeks and months. Any integer (i.e. 2 days) can serve
as the interval.
- Unlimited amount of loaded data
The user is no longer limited by a small amount of data. The program
handles thousands of bars, especially important for serious testing
of trading systems.
- Data stream overlaying
The program allows assets to be superimposed, which is invaluable
for comparing the dynamics of several securities. Besides assets,
any indicators or analysis techniques may be superimposed.
RELATED SOFTWARE DOWNLOADS FOR MULTICHARTS QUARTERLY LICENSE
|
|


 MultiCharts is a professional charting package that allows you to use thousands of
existing TradeStation studies or create your own in EasyLanguage®-compatible
language. You won't have to study anything new or redo your existing studies
-- just import ELA/ELS/ELD and apply the study to a chart. MultiCharts
supports free quotes as well as streaming data from the leading data providers/brokers
such as Interactive Brokers (TWS), eSignal, Patsystems (J-Trader), IQFeed,
MarketCast, CyberTrader, Tenfore and many others.
 BestShareware.net. All rights reserved.


